Focus beyond the TOOL

What is the most commonly perceived skill set of a performance tester? Most of the times, it is mistakenly considered synonymous to having the knowledge on a performance testing tool, like HP LoadRunner, rational performance tester or any other industry standard tool. Most of the testers also carry this perception, thus tend to get bored with their work, considering that they’ve already mastered the tool and not learnt anything beyond “the tool”.
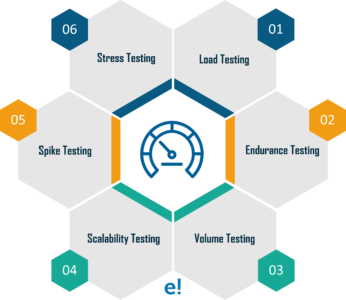
Image result for perf test tools

However, in reality, the knowledge of one performance testing tool, accounts for approximately only one-third of total expected skill sets of a performance tester. Why is building the needed skill set so critical for a performance testing team?Consider the following scenario –In line with the belief that the skill set of a performance tester is limited to the knowledge of a “single performance test tool”, a project manager for a performance testing project hires people in his team who have been successful at functional automation using industry standard tools.

All the testers put in a lot of effort, learning the performance testing tool and working relentlessly on the project for six months. However, a lot of defects are uncovered in UAT, which were missed during system testing.What could have gone wrong in this scenario? It was obviously not the lack of effort in “functional automation” by testers, but because there was a lack of the “bigger picture vision” or the “macro- vision”, needed for a successful performance test.One can become competent in the usage of a testing tool in a few months. However, becoming completely proficient in performance testing takes a couple of years. That is why it becomes very important to have the right career model in place for a performance tester.

Related image

Performance testing professionals need to be made aware of other aspects of performance testing other than only learning and using a tool. These other aspects would include awareness and knowledge on the performance requirement gathering, performance test strategizing, capacity planning, work load modeling and performance engineering activities. They should be able to see a career path in performance engineering or performance consulting after performance testing.

 

Source : https://www.infosys.com/IT-services/validation-solutions/white-papers/Documents/career-performance-testing.pdf

Performance Test & Continuous Integration

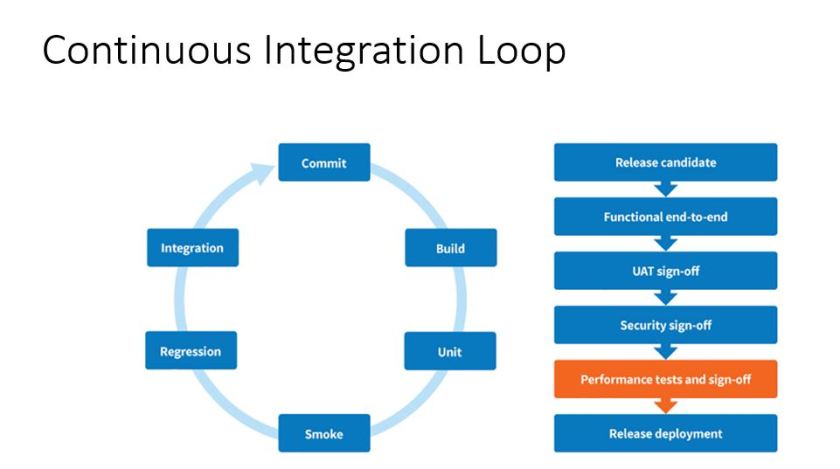
Continuous Integration

  • Continuous Integration is a practice where a team of developers intermittently merges their code changes into a shared repository. Developers are integrating multiple times throughout the day and ideally committing to changes about once a day or a few times a week.
  • Continuous Integration is preferred by software teams because it allows daily constant feedback in development from all contributors, while it’s easier to catch and resolve bugs early on in the process.


11

Continuous Integration – Advantages

Detect Performance Degradations When They Happen

As these tests will not be verifying the user experience, we need a different focus. Our strategy is to define a benchmark for a specific version of the system, and then run tests continuously in order to detect a degradation. In a certain way, it’s assuming that the performance that you have today in your infrastructure is okay, and you do not want to miss it when any change negatively affects  this current performance.

Performance Trend Identification

Because we are running the test for every build. We can have track of performance of the application. So that it will help us to maintain the applications performance well under the SLA.


NIOInputStream vs IOInputStream

cdc

Main Differences Betwen Java NIO and IO

The table below summarizes the main differences between Java NIO and IO. I will get into more detail about each difference in the sections following the table.

IO NIO
Stream oriented Buffer oriented
Blocking IO Non blocking IO
Selectors


IO

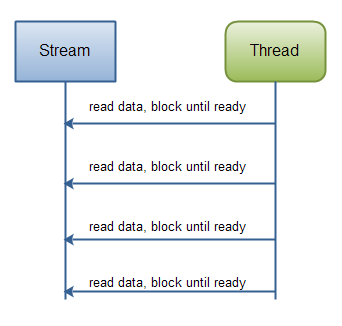
Java IO’s various streams are blocking. That means, that when a thread invokes a read() or write(), that thread is blocked until there is some data to read, or the data is fully written. The thread can do nothing else in the meantime.

If you have fewer connections with very high bandwidth, sending a lot of data at a time, perhaps a classic IO server implementation might be the best fit. This diagram illustrates a classic IO server design:

nio-vs-io-1

NIO

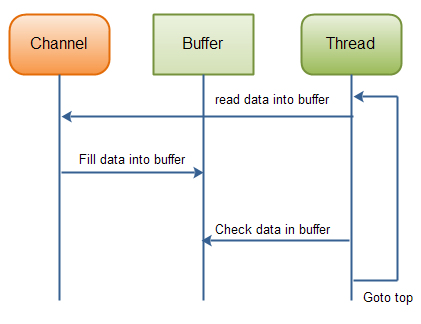
Java NIO’s non-blocking mode enables a thread to request reading data from a channel, and only get what is currently available, or nothing at all, if no data is currently available. Rather than remain blocked until data becomes available for reading, the thread can go on with something else.NIO allows you to manage multiple channels (network connections or files) using only a single (or few) threads, but the cost is that parsing the data might be somewhat more complicated than when reading data from a blocking stream.

nio-vs-io-2

If you need to manage thousands of open connections simultanously, which each only send a little data, for instance a chat server, implementing the server in NIO is probably an advantage. Similarly, if you need to keep a lot of open connections to other computers, e.g. in a P2P network, using a single thread to manage all of your outbound connections might be an advantage.


What Can Plugins Do in HUDSON

Hudson defines extensibility points, which are interfaces or abstract classes that model an aspect of a build system. Those interfaces define contracts of what need to be implemented, and Hudson allows plugins to contribute those implementations.

One of best features of Hudson is how easy is to extend it. As result there are many plug-ins developed by third parties that can perform a lot of tasks related to the activity of a development team.

Before we proceed with developing the plugin, there is an important concept to understand: How the different project types invoke their plugins.
Currently, one of the biggest source of confusion for end users of Hudson is that most of the plugins do not work with the “m2 project type”. This is because there are essentially two completely different implementations of plugins.

  • Normal plugin
  • Maven plugin

Normal” plugins work with all project types except the  “m2projecttype”, Best performance will be achieved if the heavy lifting is performed on the slave and then finally the results are sent to the master.

Maven plugins only work with the “m2 project type”(m2-maven 2).The plugin author does not have to be as mindful about overloading the master, as by default, they are executing on the slave, however, the side effect is that the plugin does not have full access to all the Hudson objects.

GoAccess: open source real-time web log analyzer/ viewer

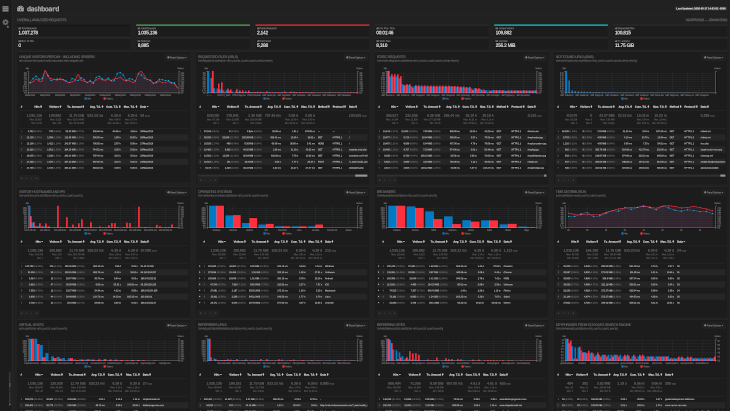
GoAccess is an open source real-timeweb log analyzer and interactive viewer that runs in a terminal in *nix systems or through your browser.

It provides fast and valuable HTTP statistics for system administrators that require a visual server report on the fly

GoAccess was designed to be a fast, terminal-based log analyzer. Its core idea is to quickly analyze and view web server statistics in real time without needing to use your browser (great if you want to do a quick analysis of your access log via SSH, or if you simply love working in the terminal).

While the terminal output is the default output, it has the capability to generate a complete real-time HTML report (great for analytics, monitoring and data visualization), as well as a JSON, and CSV report.

  • Fast, real-time, millisecond/second updates, written in C
  • Only ncurses as a dependency
  • Nearly all web log formats (Apache, Nginx, Amazon S3, Elastic Load Balancing, CloudFront, etc)
  • Simply set the log format and run it against your log
  • Beautiful terminal and bootstrap dashboards (Tailor GoAccess to suit your own color taste/schemes)
  • and of course, Valgrind tested.

Source: https://goaccess.io/

netdata – linux monitoring tool (open source)

netdata is a system for distributed real-time performance and health monitoring. It provides unparalleled insights, in real-time, of everything happening on the system it runs (including applications such as web and database servers), using modern interactive web dashboards.

netdata is fast and efficient, designed to permanently run on all systems (physical & virtual servers, containers, IoT devices), without disrupting their core function.


netdata

Monitor everything

Analyze thousands of metrics per server. Everything about the system (CPU, RAM, disks, network, firewall, QoS, NFS, etc) and detailed performance metrics for dozens of Linux applications (such as web servers, databases servers, email servers, DNS servers, etc) and SNMP devices.

With alarms

Alarms can be set on any metric monitored by netdata. Alarm notifications are role-based and support dynamic thresholds, hysteresis and can be dispatched via multiple methods (such as email, slack.com, pushover.net, pushbullet.com telegram.org, twilio.com).

In real-time

netdata collects thousands of metrics per server per second, with just 1% CPU utilization of a single core, a few MB of RAM and no disk I/O at all. View everything on stunning real-time interactive web dashboards, even when netdata is running on low-end hardware.

Out of the box

netdata supports auto-detection for everything. It collects more than 5000 metrics automatically, with zero configuration, it has zero dependencies, requires zero maintenance and comes with more than 100 alarms pre-configured to detect common failures, performance and availability issues.

Embeddable

netdata can run anywhere a Linux kernel runs (even IoT) and its charts can be embedded on any web site too.

Customizable

Custom dashboards can be built using simple HTML (no javascript necessary).

Extensible

Anything you can get a number for, can be given to netdata, using its Plugin API (anything can be a netdata plugin, BASH, python, perl, node.js, java, Go, ruby, etc).

Scalable

netdata scales out, your web browser is the central netdata connecting all your serverstogether. netdata can archive its metrics to graphite or opentsdb at a lower rate, to avoid congesting these servers with the amount of data collected.


source: http://my-netdata.io/

Why file descriptor metrics are important in performance testing

A file descriptor is an object that a process uses to read or write to an open file and to open network sockets. An Operating System places limits on the number of file descriptors that a process may open. A lack of available file descriptors can cause a wide variety of symptoms which are not always easily traced back to. The Open Files Descriptors (OFD) provides a count of the total number of file descriptors that are currently allocated and open for processing. The percentage of the total number of open file descriptors with respect to the maximum allowed count of descriptors for processing is a good metric for evaluating the health of a web application
A file descriptor is an opaque handle that is used in the interface between user and kernel space to identify file/socket resources. Therefore, when you use open() or socket() (system calls to interface to the kernel), you are given a file descriptor, which is an integer (it is actually an index into the processes u structure – but that is not important). Therefore, if you want to interface directly with the kernel, using system calls to read(), write(), close() etc. the handle you use is a file descriptor.

There is a layer of abstraction overlaid on the system calls, which is the stdio interface. This provides more functionality/features than the basic system calls do. For this interface, the opaque handle you get is a FILE*, which is returned by the fopen() call. There are many many functions that use the stdio interface fprintf(), fscanf(), fclose(), which are there to make your life easier. In C, stdin, stdout, and stderr are FILE*, which in UNIX respectively map to file descriptors 0, 1 and 2.


Step # 1 Find Out PID

To find out PID for mysqld process, enter:
# ps aux | grep mysqld
OR
# pidof mysqld
Output:

28290

Step # 2 List File Opened By a PID # 28290

Use the lsof command or /proc/$PID/ file system to display open fds (file descriptors), run:
# lsof -p 28290
# lsof -a -p 28290

OR
# cd /proc/28290/fd
# ls -l | less

You can count open file, enter:
# ls -l | wc -l

Tip: Count All Open File Handles

To count the number of open file handles of any sort, type the following command:
# lsof | wc -l
Sample outputs:

5436

Emptying the buffers cache in linux

If you ever want to empty it you can use this chain of commands.

# free && sync && echo 3 > /proc/sys/vm/drop_caches && free

total used free shared buffers cached
Mem: 1018916 980832 38084 0 46924 355764
-/+ buffers/cache: 578144 440772
Swap: 2064376 128 2064248
total used free shared buffers cached
Mem: 1018916 685008 333908 0 224 108252
-/+ buffers/cache: 576532 442384
Swap: 2064376 128 2064248
You can signal the Linux Kernel to drop various aspects of cached items by changing the numeric argument to the above command.

To free pagecache:

# echo 1 > /proc/sys/vm/drop_caches
To free dentries and inodes:

# echo 2 > /proc/sys/vm/drop_caches
To free pagecache, dentries and inodes:

# echo 3 > /proc/sys/vm/drop_caches
The above are meant to be run as root. If you’re trying to do them using sudo then you’ll need to change the syntax slightly to something like these:

$ sudo sh -c ‘echo 1 >/proc/sys/vm/drop_caches’
$ sudo sh -c ‘echo 2 >/proc/sys/vm/drop_caches’
$ sudo sh -c ‘echo 3 >/proc/sys/vm/drop_caches’

dstat -server metrics collection tool

Dstats is a versatile resource statistic tool. This tool combines the ability of iostat, vmstat, netstat, and ifstat. Dstat allow us to monitor the server resources in real-time. When you need to gather those information real-time, dstat will fit your need. dstat also cleverly gives you the most detailed information in columns and clearly indicates in what magnitude and unit the output is displayed. Less confusion, less mistakes, more efficient.

Dstat is unique in letting you aggregate block device throughput for a certain diskset or network bandwidth for a group of interfaces, ie. you can see the throughput for all the block devices that make up a single filesystem or storage system

dstat [-afv] [options..] [delay [count]]


In dstat there are a lot of options, you can see all with the command man dstat, some of the most useful parameters are:

  • -l = shows load statistics
  • -m = shows the memory usage (used, buffer, cache, free)
  • -r = displays I/O statistics,
  • -s = shows the swap usage
  • -t = puts the current time in the first column
  • –fs = displays file system stats (includes amount of files and used inodes)
  • –nocolor = sometimes very useful…
  • –socket = shows interesting network statistics
  • –tcp = displays common TCP stats
  • –udp = shows you the listen and active figures for the UDP usage

Sample :

dstat -tcmsn -N eth0  60

every 60 seconds it will collect metrics

You can redirect it to csv as well

dstat -c -n -N eth0,lo -m -s -d –output dstat.csv

dstat


vmstat is a nice tool

vmstat is a nice tool, to analyze the Linux / UNIX server performance.

 procs            memory                        swap        io       system    cpu
 r  b   swpd   free   buff  cache         si   so    bi    bo     in    cs       us sy id wa
 2  5 375912  19548  17556 477472    0    1     0     0      1     1        1  0  0  1
 0  4 375912  18700  17556 478264    0    0  1044   0     774  1329   8  1   0  91
 0  5 375912  17664  17556 479168    0    0  1160   0     764  1110   8  1   0  91
 1  8 375912  15836  17568 479796    0    0  1144   840  751  1622  16 7   0  78
 0  7 375912  19340  17576 480224    0    0  1224   148  587  1958  17 18  0  65
 2  0 375912  18288  17588 481036    0    0   812    0     845  1732  18 3  21  59
 0  2 375912  15868  17588 481528    0    0  1012   0     588   941   4   1  5   90 


Proc: 
——-
r: How many processes are waiting for CPU time.
b: Wait Queue – Process which are waiting for I/O (disk, network, user 
    input,etc..) 


Memory: 
———–
swpd: shows how many blocks are swapped out to disk (paged). Total Virtual  
          memory usage. 
            
Note: you can see the swap area configured in server using cat proc/swaps


free: Idle Memory 
buff: Memory used as buffers, like before/after I/O operations
cache: Memory used as cache by the Operating System


Swap: 
———
si: How many blocks per second the operating system is swapping in. i.e 
    Memory swapped in from the disk (Read from swap area to Memory)
so: How many blocks per second the operating system is swaped Out. i.e 
     Memory swapped to the disk (Written to swap area and cleared from 
     Memory)


In Ideal condition, We like to see si and so at 0 most of the time, and we definitely don’t like to see more than 10 blocks per second.


IO: 
——
bi: Blocks received from block device – Read (like a hard disk) 
bo: Blocks sent to a block device – Write


System: 
————-
in: The number of interrupts per second, including the clock. 
cs: The number of context switches per second. 


CPU: 
——–
us: percentage of cpu used for running non-kernel code. (user time, including 
     nice time) 
sy: percentage of cpu used for running kernel code. (system time – network, IO 
     interrupts, etc) 
id: cpu idle time in percentage.
wa: percentage of time spent by cpu for waiting to IO.